基于自定义指标
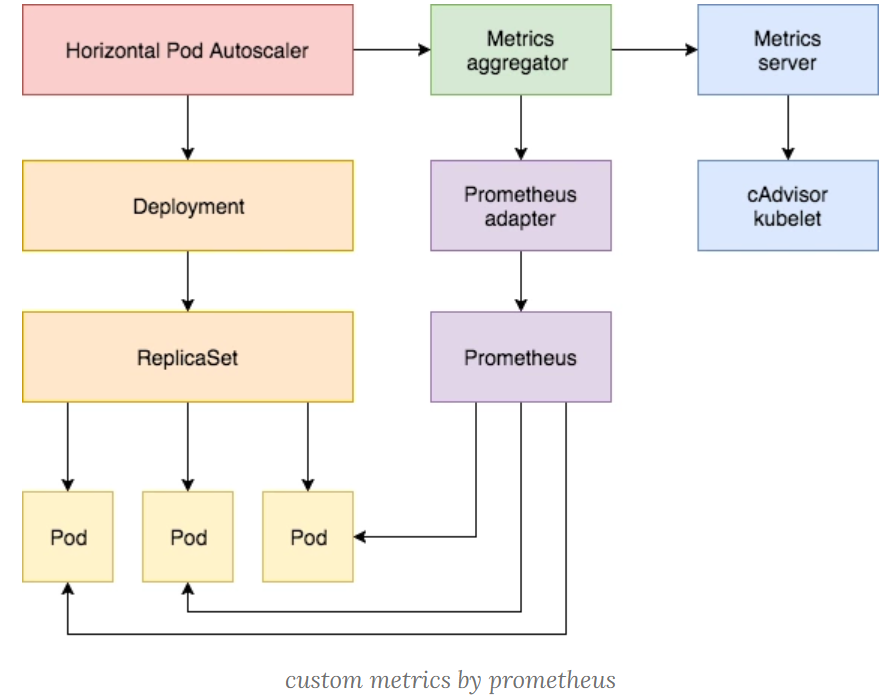
除了基于 CPU 和内存来进行自动扩缩容之外,我们还可以根据自定义的监控指标来进行。这个我们就需要使用 Prometheus Adapter,Prometheus 用于监控应用的负载和集群本身的各种指标,Prometheus Adapter 可以帮我们使用 Prometheus 收集的指标并使用它们来制定扩展策略,这些指标都是通过 APIServer 暴露的,而且 HPA 资源对象也可以很轻易的直接使用。
下面来看具体怎么实现的!
部署应用
首先,我们部署一个示例应用,在该应用程序上测试 Prometheus 指标自动缩放,资源清单文件如下所示:(podinfo.yaml)
1 | --- |
接下来我们将 Prometheus-Adapter 安装到集群中,这里选用helm安装,当然也可以直接yaml文件安装。
Prometheus-Adapter规则
Prometheus-Adapter 规则大致 可以分为以下几个部分:
seriesQuery:查询 Prometheus 的语句,通过这个查询语句查询到的所有指标都可以用于 HPAseriesFilters:查询到的指标可能会存在不需要的,可以通过它过滤掉。resources:通过seriesQuery查询到的只是指标,如果需要查询某个 Pod 的指标,肯定要将它的名称和所在的命名空间作为指标的标签进行查询,resources就是将指标的标签和 k8s 的资源类型关联起来,最常用的就是 pod 和 namespace。有两种添加标签的方式,一种是overrides,另一种是template。overrides:它会将指标中的标签和 k8s 资源关联起来。上面示例中就是将指标中的 pod 和 namespace 标签和 k8s 中的 pod 和 namespace 关联起来,因为 pod 和 namespace 都属于核心 api 组,所以不需要指定 api 组。当我们查询某个 pod 的指标时,它会自动将 pod 的名称和名称空间作为标签加入到查询条件中。比如pod: {group: "apps", resource: "deployment"}这么写表示的就是将指标中 podinfo 这个标签和 apps 这个 api 组中的deployment资源关联起来;- template:通过 go 模板的形式。比如
template: "kube_<<.Group>>_<<.Resource>>"这么写表示,假如<<.Group>>为 apps,<<.Resource>>为 deployment,那么它就是将指标中kube_apps_deployment标签和 deployment 资源关联起来。
name:用来给指标重命名的,之所以要给指标重命名是因为有些指标是只增的,比如以 total 结尾的指标。这些指标拿来做 HPA 是没有意义的,我们一般计算它的速率,以速率作为值,那么此时的名称就不能以 total 结尾了,所以要进行重命名。matches:通过正则表达式来匹配指标名,可以进行分组as:默认值为$1,也就是第一个分组。as为空就是使用默认值的意思。
metricsQuery:这就是 Prometheus 的查询语句了,前面的seriesQuery查询是获得 HPA 指标。当我们要查某个指标的值时就要通过它指定的查询语句进行了。可以看到查询语句使用了速率和分组,这就是解决上面提到的只增指标的问题。Series:表示指标名称LabelMatchers:附加的标签,目前只有pod和namespace两种,因此我们要在之前使用resources进行关联GroupBy:就是 pod 名称,同样需要使用resources进行关联。
安装
我们新建
hpa-prome-adapter-values.yaml文件覆盖默认的 Values 值 ,安装Prometheus-Adapter,我用的helm2文件如下:
1
2
3
4
5
6
7
8
9
10
11
12
13
14
15
16
rules:
default: false
custom:
- seriesQuery: 'http_requests_total'
resources:
overrides:
kubernetes_namespace:
resource: namespace
kubernetes_pod_name:
resource: pod
name:
matches: "^(.*)_total"
as: "${1}_per_second"
metricsQuery: (sum(rate(<<.Series>>{<<.LabelMatchers>>}[1m])) by (<<.GroupBy>>))
prometheus:
url: http://prometheus-clusterip.monitor.svc.cluster.local安装
1
2
helm repo add apphub https://apphub.aliyuncs.com/
helm install --name prome-adapter --namespace monitor -f hpa-prome-adapter-values.yaml apphub/prometheus-adapter等一小会儿,安装完成后,可以使用下面的命令来检测是否生效了:
1
2
3
4
5
6
7
8
9
10
11
12
13
14
15
16
17
18
19
20
21
22
23
24
25
26
[root@prometheus]# kubectl get --raw="/apis/custom.metrics.k8s.io/v1beta1" | jq
{
"kind": "APIResourceList",
"apiVersion": "v1",
"groupVersion": "custom.metrics.k8s.io/v1beta1",
"resources": [
{
"name": "namespaces/http_requests_per_second",
"singularName": "",
"namespaced": false,
"kind": "MetricValueList",
"verbs": [
"get"
]
},
{
"name": "pods/http_requests_per_second",
"singularName": "",
"namespaced": true,
"kind": "MetricValueList",
"verbs": [
"get"
]
}
]
}我们可以看到 http_requests_per_second 指标可用。 现在,让我们检查该指标的当前值:
1
2
3
4
5
6
7
8
9
10
11
12
13
14
15
16
17
18
19
20
21
22
23
24
25
26
27
28
29
30
31
32
33
34
[root@prometheus]# kubectl get --raw "/apis/custom.metrics.k8s.io/v1beta1/namespaces/default/pods/*/http_requests_per_second" | jq .
{
"kind": "MetricValueList",
"apiVersion": "custom.metrics.k8s.io/v1beta1",
"metadata": {
"selfLink": "/apis/custom.metrics.k8s.io/v1beta1/namespaces/default/pods/%2A/http_requests_per_second"
},
"items": [
{
"describedObject": {
"kind": "Pod",
"namespace": "default",
"name": "podinfo-5cdc457c8b-99xtw",
"apiVersion": "/v1"
},
"metricName": "http_requests_per_second",
"timestamp": "2020-06-02T12:01:01Z",
"value": "888m",
"selector": null
},
{
"describedObject": {
"kind": "Pod",
"namespace": "default",
"name": "podinfo-5cdc457c8b-b7pfz",
"apiVersion": "/v1"
},
"metricName": "http_requests_per_second",
"timestamp": "2020-06-02T12:01:01Z",
"value": "888m",
"selector": null
}
]
}下面部署hpa对象
1
2
3
4
5
6
7
8
9
10
11
12
13
14
15
16
apiVersion: autoscaling/v2beta1
kind: HorizontalPodAutoscaler
metadata:
name: podinfo
spec:
scaleTargetRef:
apiVersion: extensions/v1beta1
kind: Deployment
name: podinfo
minReplicas: 2
maxReplicas: 5
metrics:
- type: Pods
pods:
metricName: http_requests_per_second
targetAverageValue: 3部署之后,可见:
1
2
3
4
5
6
7
8
9
10
11
12
13
14
15
16
17
18
19
20
21
22
23
[root@prometheus-adapter]# kubectl get hpa
NAME REFERENCE TARGETS MINPODS MAXPODS REPLICAS AGE
podinfo Deployment/podinfo 911m/10 2 5 2 70s
[root@prometheus-adapter]# kubectl describe hpa
Name: podinfo
Namespace: default
Labels: <none>
Annotations: kubectl.kubernetes.io/last-applied-configuration:
{"apiVersion":"autoscaling/v2beta1","kind":"HorizontalPodAutoscaler","metadata":{"annotations":{},"name":"podinfo","namespace":"default"},...
CreationTimestamp: Tue, 02 Jun 2020 17:53:14 +0800
Reference: Deployment/podinfo
Metrics: ( current / target )
"http_requests_per_second" on pods: 911m / 10
Min replicas: 2
Max replicas: 5
Deployment pods: 2 current / 2 desired
Conditions:
Type Status Reason Message
---- ------ ------ -------
AbleToScale True ScaleDownStabilized recent recommendations were higher than current one, applying the highest recent recommendation
ScalingActive True ValidMetricFound the HPA was able to successfully calculate a replica count from pods metric http_requests_per_second做一个ab压测:
1
ab -n 2000 -c 5 http://sy.test.com:31198/
观察下hpa变化:
1
2
3
4
5
6
7
Events:
Type Reason Age From Message
---- ------ ---- ---- -------
Normal SuccessfulRescale 9m29s horizontal-pod-autoscaler New size: 3; reason: pods metric http_requests_per_second above target
Normal SuccessfulRescale 9m18s horizontal-pod-autoscaler New size: 4; reason: pods metric http_requests_per_second above target
Normal SuccessfulRescale 3m34s horizontal-pod-autoscaler New size: 3; reason: All metrics below target
Normal SuccessfulRescale 3m4s horizontal-pod-autoscaler New size: 2; reason: All metrics below target发现触发扩容动作了,副本到了4,并且压测结束后,过了5分钟左右,又恢复到最小值2个。
参考链接
—本文结束感谢您的阅读。微信扫描二维码,关注我的公众号—