Prometheus监控elasticsearch

安装监控插件

1
2
3
4
5
wget https://github.com/justwatchcom/elasticsearch_exporter/releases/download/v1.0.4rc1/elasticsearch_exporter-1.0.4rc1.linux-amd64.tar.gz

tar -zxvf elasticsearch_exporter-1.0.4rc1.linux-amd64.tar.gz
cd elasticsearch_exporter-1.0.4rc1.linux-amd64/
nohup ./elasticsearch_exporter --web.listen-address ":9109" --es.uri http://192.168.50.153:9200 &

启动成功后,可以访问 http://192.168.50.153:9109/metrics ,看抓取的信息
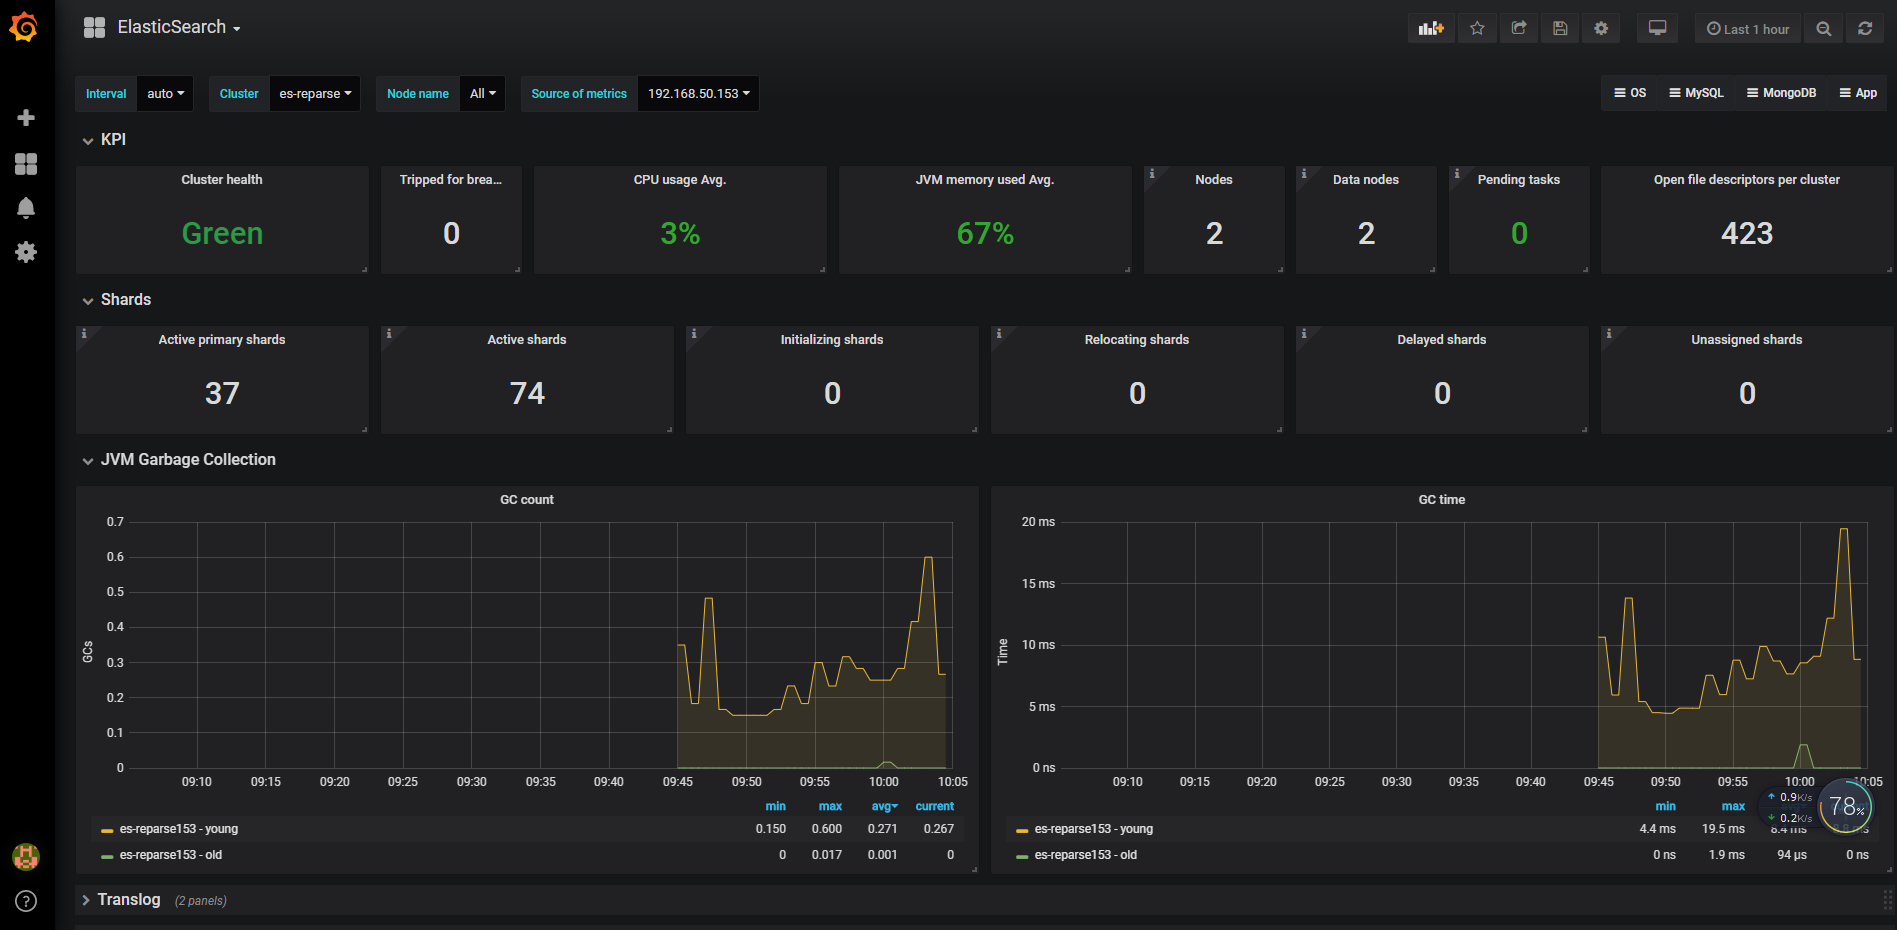
监控图表

指标 解析
##搜索和索引性能
elasticsearch_indices_search_query_total 查询总数 吞吐量
elasticsearch_indices_search_query_time_seconds 查询总时间 性能
elasticsearch_indices_search_fetch_total 提取总数
elasticsearch_indices_search_fetch_time_seconds 花费在提取上的总时间
##索引请求
elasticsearch_indices_indexing_index_total 索引的文件总数
elasticsearch_indices_indexing_index_time_seconds_total 索引文档总时间
elasticsearch_indices_indexing_delete_total 索引的文件删除总数
elasticsearch_indices_indexing_delete_time_seconds_total 索引的文件删除总时间
elasticsearch_indices_refresh_total 索引刷新总数
elasticsearch_indices_refresh_time_seconds_total 刷新指数的总时间
elasticsearch_indices_flush_total 索引刷新总数到磁盘
elasticsearch_indices_flush_time_seconds 将索引刷新到磁盘上的总时间 累计flush时间
##JVM内存和垃圾回收
elasticsearch_jvm_gc_collection_seconds_sum GC run time in seconds垃圾回收时间
elasticsearch_jvm_gc_collection_seconds_count Count of JVM GC runs垃圾搜集数
elasticsearch_jvm_memory_committed_bytes JVM memory currently committed by area最大使用内存限制
elasticsearch_jvm_memory_max_bytes 配置的最大jvm值
elasticsearch_jvm_memory_pool_max_bytes JVM内存最大池数
elasticsearch_jvm_memory_pool_peak_max_bytes 最大的JVM内存峰值
elasticsearch_jvm_memory_pool_peak_used_bytes 池使用的JVM内存峰值
elasticsearch_jvm_memory_pool_used_bytes 目前使用的JVM内存池
elasticsearch_jvm_memory_used_bytes JVM memory currently used by area 内存使用量
##集群健康和节点可用性
elasticsearch_cluster_health_status 集群状态,green( 所有的主分片和副本分片都正常运行)、yellow(所有的主分片都正常运行,但不是所有的副本分片都正常运行)red(有主分片没能正常运行)值为1的即为对应状态
elasticsearch_cluster_health_number_of_data_nodes node节点的数量
elasticsearch_cluster_health_number_of_in_flight_fetch 正在进行的碎片信息请求的数量
elasticsearch_cluster_health_number_of_nodes 集群内所有的节点
elasticsearch_cluster_health_number_of_pending_tasks 尚未执行的集群级别更改
elasticsearch_cluster_health_initializing_shards 正在初始化的分片数
elasticsearch_cluster_health_unassigned_shards 未分配分片数
elasticsearch_cluster_health_active_primary_shards 活跃的主分片总数
elasticsearch_cluster_health_active_shards 活跃的分片总数(包括复制分片)
elasticsearch_cluster_health_relocating_shards 当前节点正在迁移到其他节点的分片数量,通常为0,集群中有节点新加入或者退出时该值会增加
##资源饱和度
elasticsearch_thread_pool_completed_count 线程池操作完成(bulk、index、search、force_merge)
elasticsearch_thread_pool_active_count 线程池线程活动(bulk、index、search、force_merge)
elasticsearch_thread_pool_largest_count 线程池最大线程数(bulk、index、search、force_merge)
elasticsearch_thread_pool_queue_count 线程池中的排队线程数(bulk、index、search、force_merge)
elasticsearch_thread_pool_rejected_count 线程池的被拒绝线程数(bulk、index、search、force_merge)
elasticsearch_indices_fielddata_memory_size_bytes fielddata缓存的大小(字节)
elasticsearch_indices_fielddata_evictions 来自fielddata缓存的驱逐次数
elasticsearch_indices_filter_cache_evictions 来自过滤器缓存的驱逐次数(仅版本2.x)
elasticsearch_indices_filter_cache_memory_size_bytes 过滤器高速缓存的大小(字节)(仅版本2.x)
elasticsearch_cluster_health_number_of_pending_tasks 待处理任务数
elasticsearch_indices_get_time_seconds
elasticsearch_indices_get_missing_total 丢失的文件的GET请求总数
elasticsearch_indices_get_missing_time_seconds 花费在文档丢失的GET请求上的总时间
elasticsearch_indices_get_exists_time_seconds
elasticsearch_indices_get_exists_total
elasticsearch_indices_get_total
##主机级别的系统和网络指标
elasticsearch_process_cpu_percent Percent CPU used by process CPU使用率
elasticsearch_filesystem_data_free_bytes Free space on block device in bytes 磁盘可用空间
elasticsearch_process_open_files_count Open file descriptors ES进程打开的文件描述符
elasticsearch_transport_rx_packets_total Count of packets receivedES节点之间网络入流量
elasticsearch_transport_tx_packets_total Count of packets sentES节点之间网络出流量

prometheus配置

1
2
3
4
5
6
7
8
9
10
11
12
13
14
15
16
17
18
- job_name: 'elasticsearch'
scrape_interval: 60s
scrape_timeout: 30s
metrics_path: "/metrics"
static_configs:
- targets:
- '192.168.50.153:9109'
labels:
service: elasticsearch
relabel_configs:
- source_labels: [__address__]
regex: '(.*)\:9109'
target_label: 'instance'
replacement: '$1'
- source_labels: [__address__]
regex: '.*\.(.*)\.lan.*'
target_label: 'environment'
replacement: '$1'

之后运行重读prometheus配置命令

1
./reload-prometheus.sh

grafana模板

1
https://grafana.com/dashboards/2322

报警配置

1
2
3
4
5
6
7
8
9
10
11
12
13
14
15
16
17
18
19
20
21
22
23
24
25
26
27
28
29
30
31
32
33
34
35
36
37
38
39
40
41
42
43
44
45
46
47
48
49
50
51
52
53
54
55
56
57
58
59
60
61
62
63
64
65
66
67
68
69
70
71
72
73
74
75
76
77
78
79
80
81
82
83
groups:
- name: elasticsearchStatsAlert
rules:
- alert: Elastic_Cluster_Health_RED
expr: elasticsearch_cluster_health_status{color="red"}==1
for: 1m
labels:
severity: critical
annotations:
summary: "Instance {{ $labels.instance }}: not all primary and replica shards are allocated in elasticsearch cluster {{ $labels.cluster }}"
description: "Instance {{ $labels.instance }}: not all primary and replica shards are allocated in elasticsearch cluster {{ $labels.cluster }}."
- alert: Elastic_Cluster_Health_Yellow
expr: elasticsearch_cluster_health_status{color="yellow"}==1
for: 1m
labels:
severity: critical
annotations:
summary: " Instance {{ $labels.instance }}: not all primary and replica shards are allocated in elasticsearch cluster {{ $labels.cluster }}"
description: "Instance {{ $labels.instance }}: not all primary and replica shards are allocated in elasticsearch cluster {{ $labels.cluster }}."
- alert: Elasticsearch_JVM_Heap_Too_High
expr: elasticsearch_jvm_memory_used_bytes{area="heap"} / elasticsearch_jvm_memory_max_bytes{area="heap"} > 0.8
for: 1m
labels:
severity: critical
annotations:
summary: "ElasticSearch node {{ $labels.instance }} heap usage is high "
description: "The heap in {{ $labels.instance }} is over 80% for 15m."
- alert: Elasticsearch_health_up
expr: elasticsearch_cluster_health_up !=1
for: 1m
labels:
severity: critical
annotations:
summary: " ElasticSearch node: {{ $labels.instance }} last scrape of the ElasticSearch cluster health failed"
description: "ElasticSearch node: {{ $labels.instance }} last scrape of the ElasticSearch cluster health failed"
- alert: Elasticsearch_Too_Few_Nodes_Running
expr: elasticsearch_cluster_health_number_of_nodes < 12
for: 1m
labels:
severity: critical
annotations:
summary: "There are only {{$value}} < 12 ElasticSearch nodes running "
description: "lasticSearch running on less than 12 nodes(total 14)"
- alert: Elasticsearch_Count_of_JVM_GC_Runs
expr: rate(elasticsearch_jvm_gc_collection_seconds_count{}[5m])>5
for: 1m
labels:
severity: critical
annotations:
summary: "ElasticSearch node {{ $labels.instance }}: Count of JVM GC runs > 5 per sec and has a value of {{ $value }} "
description: "ElasticSearch node {{ $labels.instance }}: Count of JVM GC runs > 5 per sec and has a value of {{ $value }}"
- alert: Elasticsearch_GC_Run_Time
expr: rate(elasticsearch_jvm_gc_collection_seconds_sum[5m])>0.3
for: 1m
labels:
severity: critical
annotations:
summary: " ElasticSearch node {{ $labels.instance }}: GC run time in seconds > 0.3 sec and has a value of {{ $value }}"
description: "ElasticSearch node {{ $labels.instance }}: GC run time in seconds > 0.3 sec and has a value of {{ $value }}"
- alert: Elasticsearch_json_parse_failures
expr: elasticsearch_cluster_health_json_parse_failures>0
for: 1m
labels:
severity: critical
annotations:
summary: " ElasticSearch node {{ $labels.instance }}: json parse failures > 0 and has a value of {{ $value }}"
description: "ElasticSearch node {{ $labels.instance }}: json parse failures > 0 and has a value of {{ $value }}"
- alert: Elasticsearch_breakers_tripped
expr: rate(elasticsearch_breakers_tripped{}[5m])>0
for: 1m
labels:
severity: critical
annotations:
summary: " ElasticSearch node {{ $labels.instance }}: breakers tripped > 0 and has a value of {{ $value }}"
description: "ElasticSearch node {{ $labels.instance }}: breakers tripped > 0 and has a value of {{ $value }}"
- alert: Elasticsearch_health_timed_out
expr: elasticsearch_cluster_health_timed_out>0
for: 1m
labels:
severity: critical
annotations:
summary: " ElasticSearch node {{ $labels.instance }}: Number of cluster health checks timed out > 0 and has a value of {{ $value }}"
description: "ElasticSearch node {{ $labels.instance }}: Number of cluster health checks timed out > 0 and has a value of {{ $value }}"

elasticsearch-7.x监控

1
2
3
4
5
6
7
8
9
10
11
12
13
14
15
16
17
18
19
20
21
Since Elasticsearch 7.0.0 : ./bin/elasticsearch-plugin install -b https://github.com/vvanholl/elasticsearch-prometheus-exporter/releases/download/7.2.1.0/prometheus-exporter-7.2.1.0.zip

Since Elasticsearch 6.0.0 : ./bin/elasticsearch-plugin install -b https://github.com/vvanholl/elasticsearch-prometheus-exporter/releases/download/6.8.0.0/prometheus-exporter-6.8.0.0.zip

On Elasticsearch 5.x.x : ./bin/elasticsearch-plugin install -b https://github.com/vvanholl/elasticsearch-prometheus-exporter/releases/download/5.6.16.0/elasticsearch-prometheus-exporter-5.6.16.0.zip

On old 2.x.x versions : ./bin/plugin install https://github.com/vvanholl/elasticsearch-prometheus-exporter/releases/download/2.4.1.0/elasticsearch-prometheus-exporter-2.4.1.0.zip

Do not forget to restart the node after the installation!

Note that the plugin needs the following special permissions:

java.lang.RuntimePermission accessClassInPackage.sun.misc
java.lang.RuntimePermission accessDeclaredMembers
java.lang.reflect.ReflectPermission suppressAccessChecks
If you have a lot of indices and think this data is irrelevant, you can disable in the main configuration file:

prometheus.indices: false
To disable exporting cluster settings use:

prometheus.cluster.settings: false
1
2
3
4
5
6
Uninstall
Since Elasticsearch 6.0.0: ./bin/elasticsearch-plugin remove prometheus-exporter

On Elasticsearch 5.x.x: ./bin/elasticsearch-plugin remove prometheus-exporter

On old 2.x.x versions: ./bin/plugin remove prometheus-exporter

prometheus配置

1
2
3
4
5
6
7
8
- job_name: elasticsearch
scrape_interval: 10s
metrics_path: "/_prometheus/metrics"
static_configs:
- targets:
- node1:9200
- node2:9200
- node3:9200

带账号密码:

1
2
3
4
5
6
7
8
9
10
11
- job_name: 'elastic-cluster'
scrape_interval: 10s
metrics_path: '/_prometheus/metrics'
static_configs:
- targets:
- 'node1:9200'
- 'node2:9200'
- 'node3:9200'
basic_auth:
username: 'elastic'
password: 'elastic'

grafana

1
https://grafana.com/grafana/dashboards/266
Donate